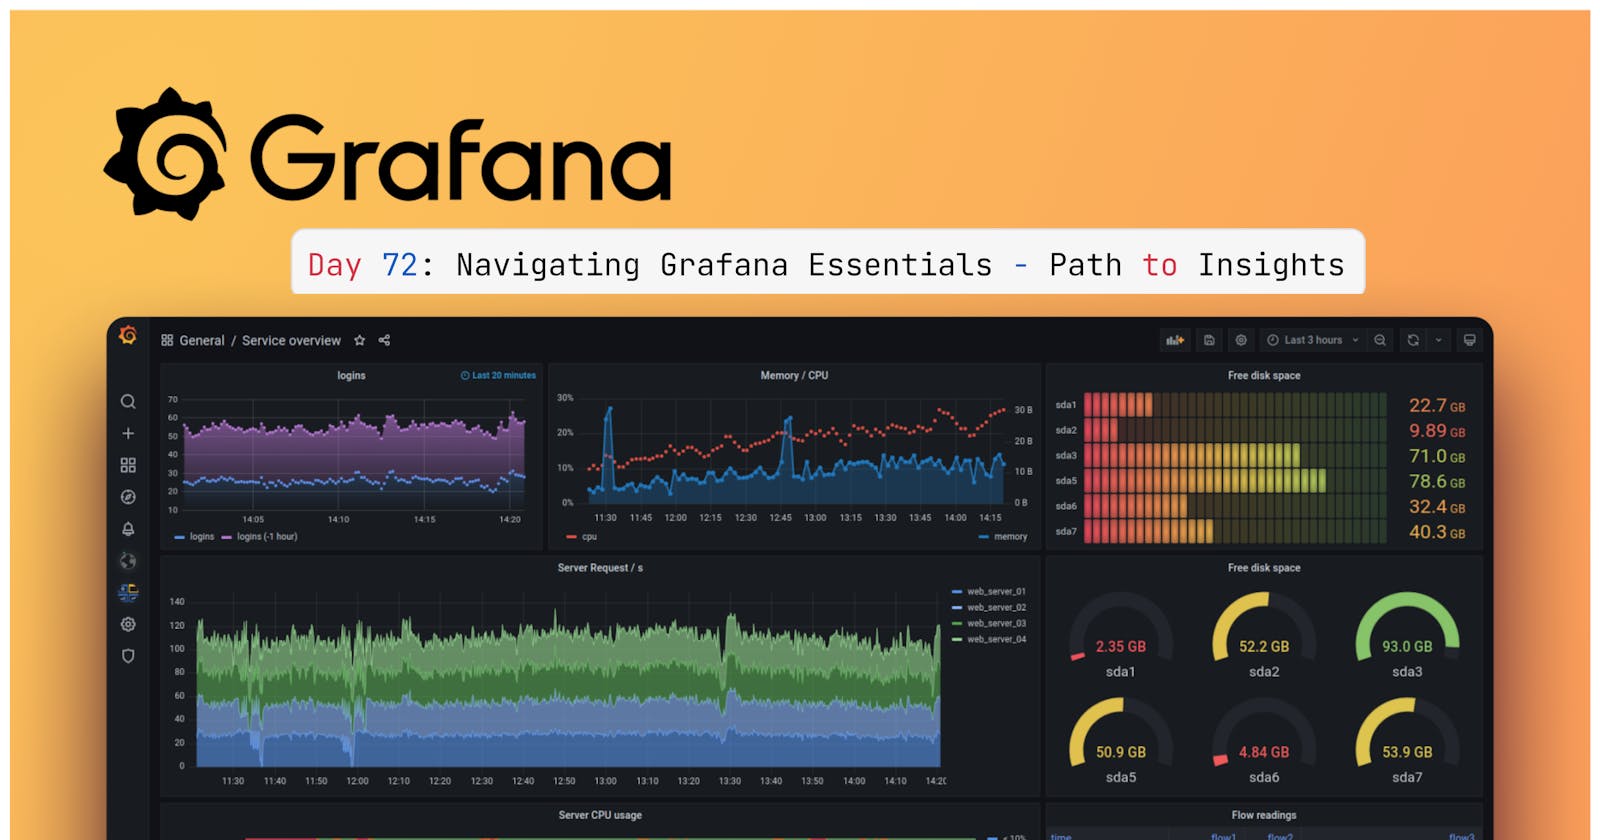


📊 What is Grafana, and why is it used for monitoring?
- Grafana is an 📈
open-sourceanalytics and monitoring platform that allows users tovisualize,query, andanalyze datafrom various data sources. It's commonly used for monitoring because it provides a user-friendly interface for creatinginteractive dashboardsandalerts, making it easier to track the performance of systems and applications.
📊 What are the features of Grafana?
🚀 Data Visualization: Grafana empowers users to design visually engaging and interactive dashboards, enabling the representation of data through charts, graphs, and other visual elements.
🔌 Data Source Integration: The flexibility of Grafana allows it to connect seamlessly with a wide array of data sources, including databases, cloud services, monitoring systems, and more. This capability enables the consolidation of data from multiple sources into a single dashboard.
📈 Time Series Data: Grafana excels at handling time series data, making it an ideal choice for monitoring and analyzing data that evolves over time, such as system metrics, performance data, and IoT-related information.
🚨 Alerting: Within Grafana, users can establish alerting rules, ensuring that they receive notifications when specific conditions are met. This feature is pivotal for proactive monitoring and the timely resolution of issues.
🧩 Plugin Architecture: Grafana's extensible plugin system offers numerous options for enhancing functionality, with a wide selection of plugins available for data sources, visualization types, and custom integrations.
📆 Data Exploration: Grafana simplifies the exploration of historical data, permitting users to focus on specific time ranges and conduct thorough data analysis, facilitating the identification of trends, anomalies, and historical context.
📧 Notification Channels: Grafana supports multiple notification channels, such as email and Slack, enabling users to configure channels for receiving alerts and updates from their dashboards.
🧑🤝🧑 Collaboration: The platform accommodates multiple users who can collaborate on dashboards and share them with team members. Access permissions can be set to control viewing and editing rights.
🧹 Data Transformation: Grafana offers the capability to manipulate and transform data before presentation on dashboards, aiding in data cleaning and ensuring meaningful data display.
🌐 Integration: Grafana seamlessly integrates with various other monitoring tools and services, including Prometheus, InfluxDB, Elasticsearch, and more, positioning itself as a central component within a comprehensive monitoring and observability stack.
📚 Documentation and Community: Grafana boasts an extensive repository of documentation and an active community, providing access to support, plugins, and resources for maximizing the potential of the platform.
📊 Customization: Grafana is highly customizable, allowing users to craft dashboards tailored to their specific requirements and branding.
Why Grafana?
Grafana is the top choice for monitoring and data visualization, and here's why: it's
open-sourceand packed with powerful features.It seamlessly connects to different data sources and provides user-friendly dashboards for making data easy to understand.
Grafana is particularly great with data that changes over time, making it ideal for tracking evolving metrics.
It also has strong alerting capabilities to
catch issuesearly and a robust plugin system that lets you customize and integrate with various tools.With Grafana, exploring historical data is a breeze, allowing for
deep analysis. It's a versatile tool that encourages teamwork and can be tailored to your specific needs, making it perfect for teams and organizations looking for effective monitoring and observability solutions.
What type of monitoring can be done via Grafana?
📊 Grafana monitoring capabilities are remarkably versatile, spanning various domains, including:
💻 Infrastructure Monitoring: Keep an eye on server and network performance.
🚀 Application Performance: Monitor applications for responsiveness and errors.
☁️ Cloud Resource Tracking: Visualize cloud resource usage and costs.
📂 Database Insights: Monitor databases for query performance and health.
🐳 Container Orchestration: Monitor Kubernetes and Docker deployments.
🌐 IoT Data Analysis: Track sensor data and IoT device health.
📜 Log Data Visualization: Create dashboards for log data trends and anomalies.
📈 Business Intelligence: Use it for business KPIs and financial metrics.
🔒 Security Analysis: Visualize security-related data and threats.
🌡️ Environmental Monitoring: Keep tabs on environmental parameters.
🛠️ Custom Dashboards: Create tailor-made monitoring solutions.
What databases work with Grafana?
- MySQL 🐬: MySQL is a popular open-source
relational databaseknown for its speed, reliability, and ease of use. It's widely used in web applications and various software systems.
- MySQL 🐬: MySQL is a popular open-source
- PostgreSQL 🐘: PostgreSQL is another open-source
relational databasewith advanced features and extensibility. It's chosen for applications requiring high data integrity and SQL compliance.
- PostgreSQL 🐘: PostgreSQL is another open-source
- MongoDB 🍃: MongoDB is a leading NoSQL database that's
document-oriented. It's ideal for handlingunstructuredorsemi-structured dataand is often used in flexible and scalable applications.
- MongoDB 🍃: MongoDB is a leading NoSQL database that's
- Oracle Database 🗄️: Oracle Database is
robust,commercial relational databasefamous for scalability and data security. It's frequently used in large enterprises and mission-critical applications.
- Oracle Database 🗄️: Oracle Database is
- InfluxDB ⏲️: InfluxDB is a specialized time-series database optimized for storing and querying time-stamped data. It's perfect for use cases involving monitoring, metrics, and IoT data.
What are Metrics and Visualizations in Grafana?
- Metrics 📊:
Metrics in Grafana are the 📈
data pointsor measurements collected from various sources. These sources can includeservers,applications,devices, or any system or service you want to monitor. Metrics are typically numerical and represent various aspects of the system's behavior, such as CPU usage, memory usage, response times, or any other quantifiable data.Grafana can collect metrics from different data sources, like databases, time-series databases (e.g., Prometheus), log files, APIs, and more. It aggregates and stores these metrics for
analysisandvisualization.
- Visualizations 📈:
Visualizations in Grafana are the 📊 graphical representations of the metrics. Grafana offers a wide range of visualization options, including charts, graphs, and tables, to help you make sense of the metrics data. Some common visualizations include:
- Time Series Graphs 📈: Line charts, bar charts, and scatter plots are used to represent time series data, showing how metrics change over time.
- Gauges ⏩: Gauges are used to represent single values, such as the current value of a metric, often used for displaying the current state of a system.
- Heatmaps 🔥: Heatmaps help visualize patterns or correlations in data using color-coding.
- Tables 📋: Tabular data is presented in tables, allowing for easy inspection of specific values.
- Single Stats 📈: Single statistics are single-number representations of a metric, useful for displaying key performance indicators.
- Alert Lists 🚨: Alert lists show triggered alerts, indicating when specific conditions are met.
What is the difference between Grafana vs Prometheus?
| Grafana | Prometheus |
| Purpose 📊: Grafana is a visualization and monitoring platform that provides interactive dashboards to visualize data from various sources. It focuses on data presentation and user-friendly dashboards. | Purpose 📈: Prometheus is a monitoring and alerting toolkit designed to collect, store, and query time-series data, primarily for system and application metrics. |
| Use Case 📊: Used for creating visually appealing dashboards, monitoring system health, and analyzing data trends. It connects to multiple data sources for visualization. | Use Case 📈: Primarily used for scraping and storing metrics data from applications and systems. It excels at alerting based on specific conditions. |
| Data Collection 📊: Stores dashboards, alerts, and user preferences, but not the underlying metrics data. | Data Collection 📈: Has native alerting capabilities and can trigger alerts based on metric conditions. |
| Data Storage 📊: Offers a wide range of visualization options, including charts, graphs, tables, and custom plugins. | Data Storage 📈: Focuses on storing and querying metrics data but does not provide visualization capabilities. |
| Alerting 📊: Provides an interactive and customizable dashboard interface for users to create and explore data visualizations. | Alerting 📈: Has a simple web UI for querying and graphing data, but it's not as feature-rich as Grafana for data presentation. |
| Integration 📊: Integrates with various data sources, including Prometheus, InfluxDB, Elasticsearch, and more, making it a central hub for data visualization. | Integration 📈: Typically used as a data source for Grafana but can also integrate with other alerting and monitoring tools. |