

What is Prometheus ?
Prometheus is an
open-source monitoringandalerting toolkitbuild bySoundCloudwhich is reliable and scalable.It is a part of the Cloud Native Computing Foundation (CNCF) and is widely used in
cloud-native environments.Prometheus excels in monitoring dynamic, containerized, and microservices-based architectures with automatic service discovery and scalability.
Its
multi-dimensional data modelandtime-series datahandling suit rapidly changing environments.Built-in alerting, powerful query language (PromQL), and an active community make Prometheus a key tool for proactive issue resolution and insights into modern architectures.
Features of Prometheus :
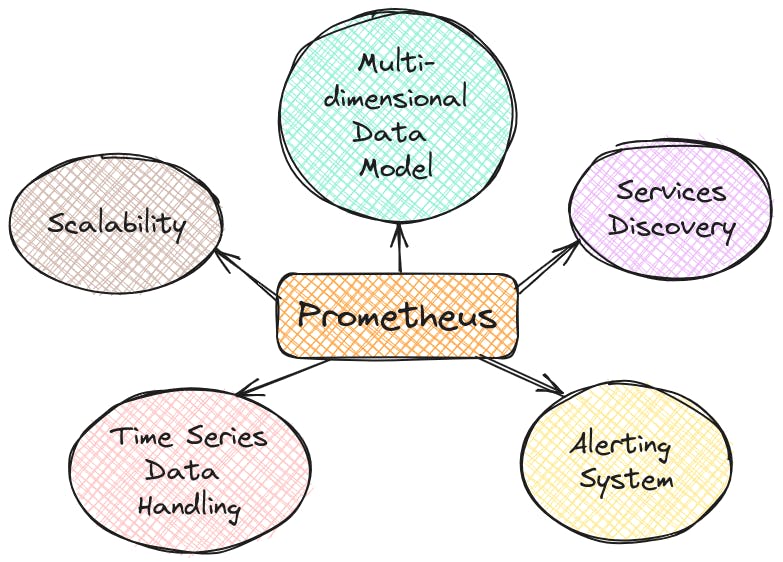
Service Discovery: Prometheus dynamically identifies and monitors services, adapting to changes in the environment without manual configuration.
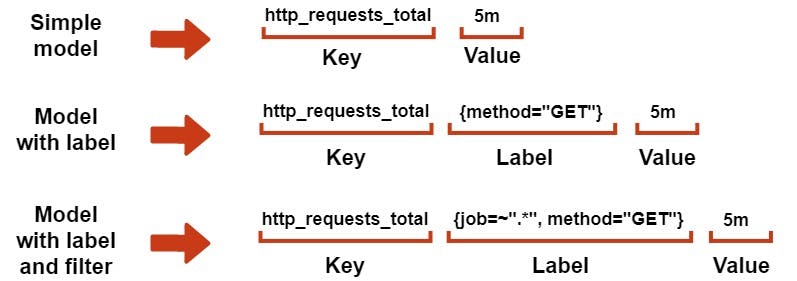
Multi-dimensional Data Model: Metrics are enriched with labels, allowing for detailed categorization and effective querying for insights.
Time Series Data Handling: Captures and stores time-stamped data, enabling analysis of performance trends and historical behavior.
Alerting System: Prometheus proactively alerts operators to potential issues by triggering notifications when predefined conditions are met.
Scalability: Designed to handle large and dynamic deployments, Prometheus scales seamlessly to meet the demands of modern, evolving architectures.
Architecture of Prometheus :
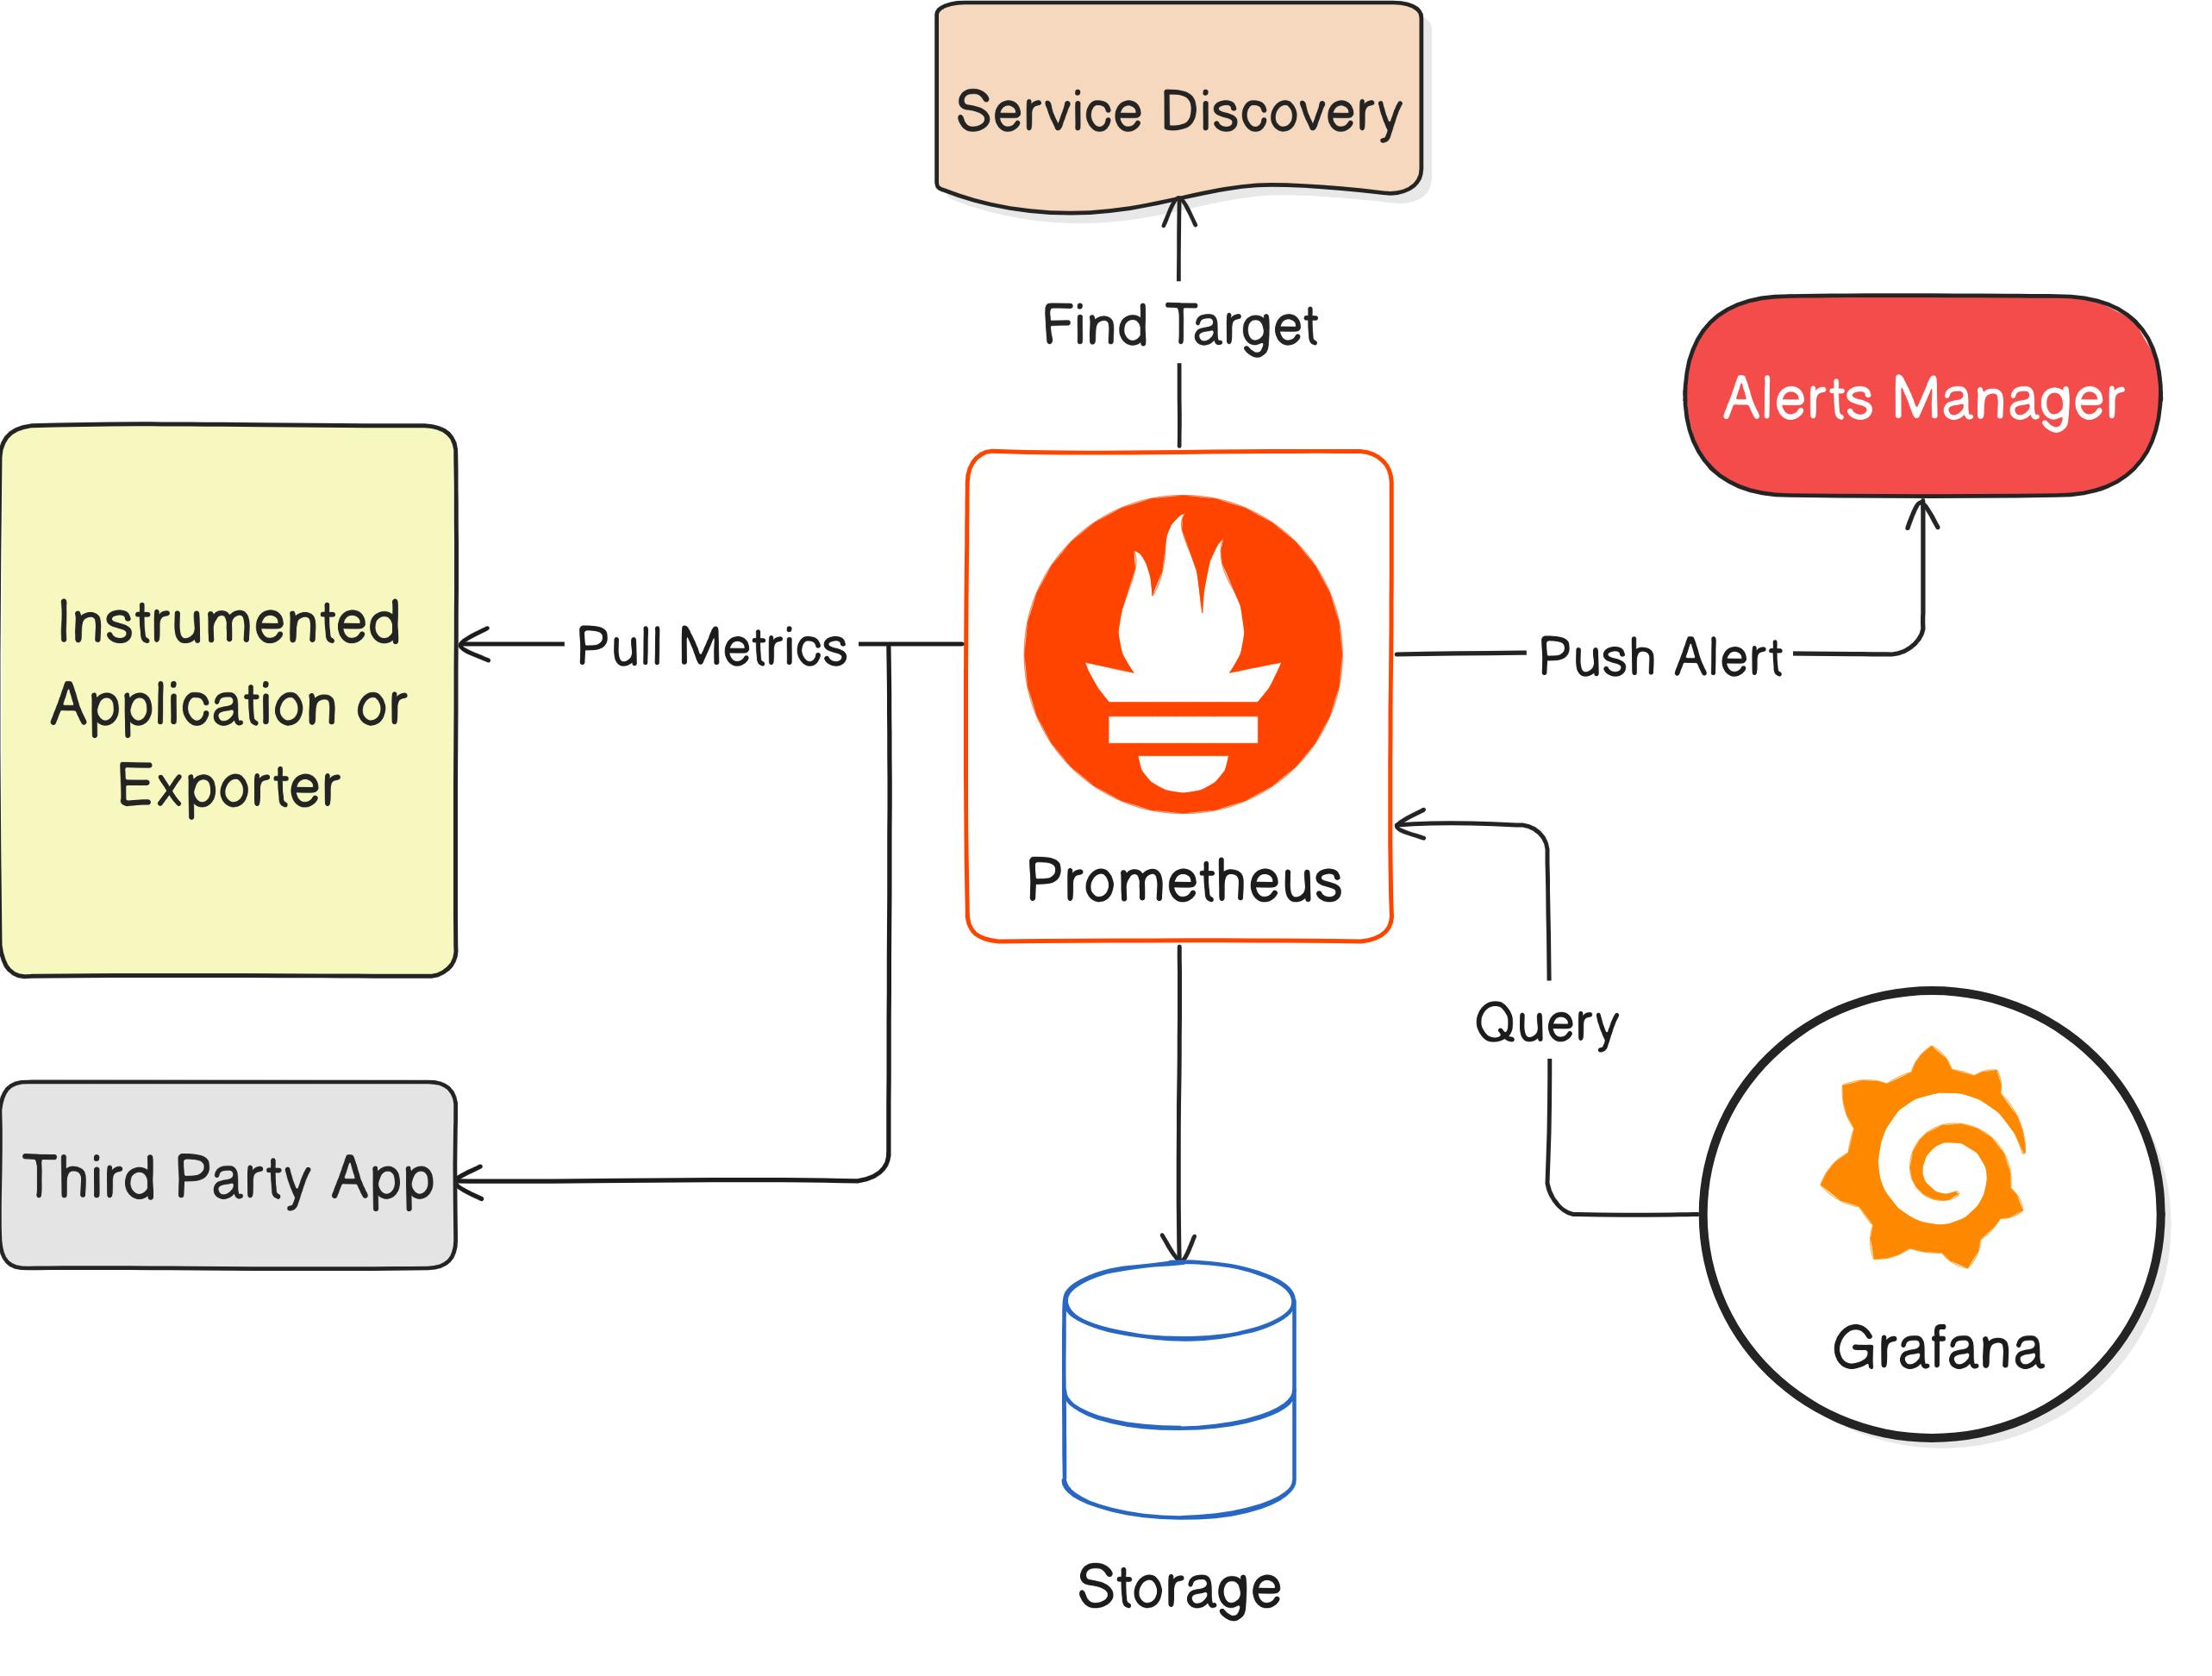
Prometheus -> Service Discovery
Prometheususesservice discovery, like DNS-based discovery, todynamically findandmonitor targets (services). Configured with mechanisms such as DNS queries, Prometheus updates its target list based on dynamic changes in the environment. This ensuresautomatic adaptationto evolving service landscapes without manual intervention.Prometheus sends alerts to the Alertmanager using a
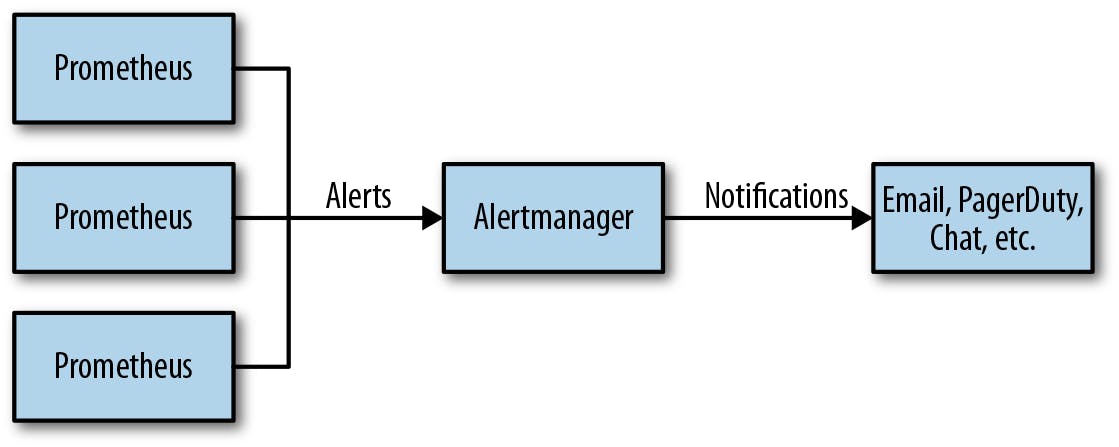
push mechanismwhen predefined conditions are met. The Alertmanager then handles and processes these alerts,deduplicates them,applies grouping, and forwardsnotifications to configured receivers, such as email or webhooks. Thispush-based alertingsystem enables timely response tocritical conditionsin a monitored environment.Prometheus uses a
time-series databasewith a Write-Ahead Log (WAL) for durability. It employsSnappy compressionandleveled compactionfor efficient storage. Data is organized in block-based storage, andretention policieshelp managedata expiration. Periodic compaction operationsoptimize performance, andsnapshot backupsprovide disaster recovery options.Prometheus collects data, Grafana visualizes it. Together, they create dynamic dashboards for monitoring and alerting. Integration allows seamless display of Prometheus metrics in Grafana's user-friendly interface, enhancing overall system observability.
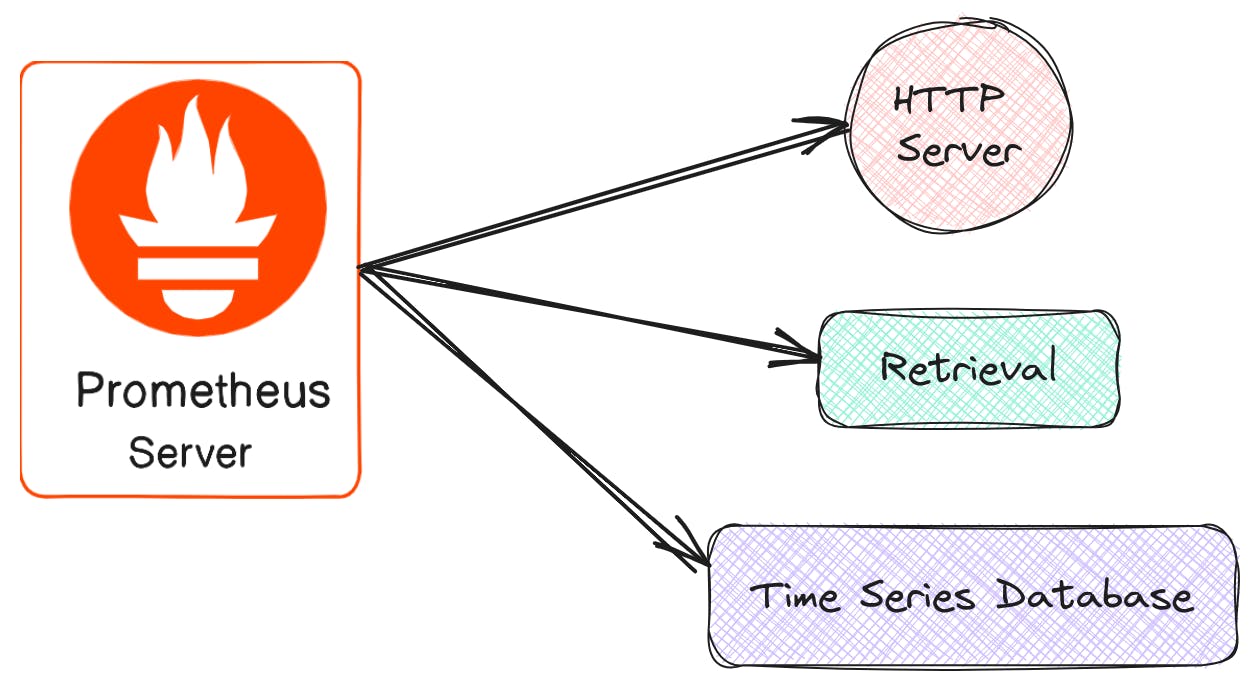
Components of Prometheus :
Prometheus Server: The heart of the ecosystem, the Prometheus server scrapes metrics from instrumented applications and services via HTTP endpoints. It stores the collected data in its internal time series database, allowing you to analyze and visualize it later.
Client Libraries: To expose metrics for Prometheus scraping, applications need to be instrumented using client libraries. Prometheus offers libraries for various programming languages like Go, Python, Java, and more. These libraries make it easy to add instrumentation code for collecting and exporting metrics.
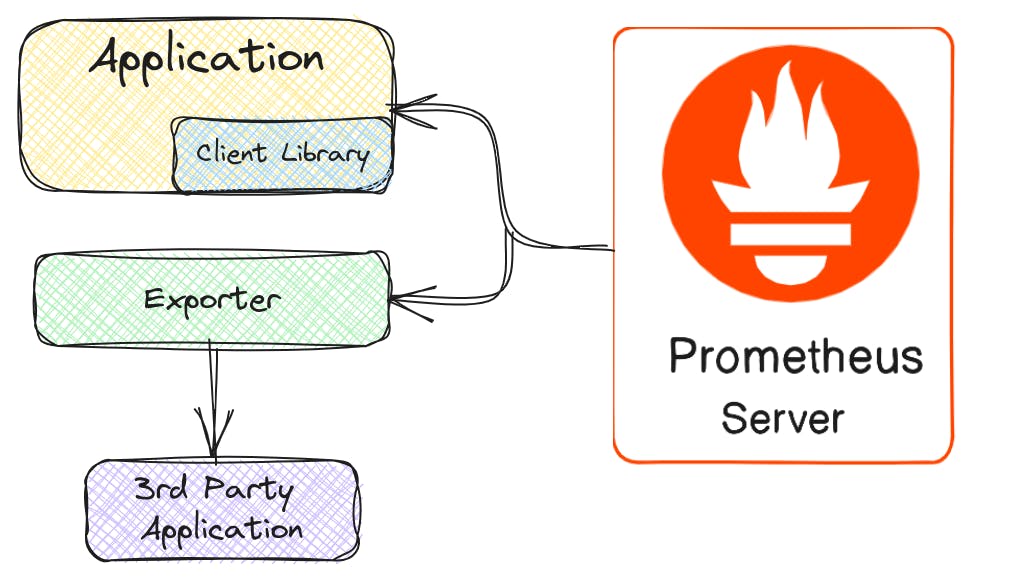
Targets: Prometheus discovers targets where metrics reside through static configuration files or service discovery mechanisms like Kubernetes. Based on these targets, the server schedules scraping jobs to collect data at regular intervals.

Prometheus Query Language (PromQL): A powerful query language specifically designed for analyzing Prometheus data. PromQL allows you to filter, aggregate, and manipulate time series data to gain insights into your system's behavior. You can use PromQL to create dashboards, generate alerts, and perform various other analyses.
Alertmanager: Prometheus can trigger alerts based on predefined rules when specific metrics breach certain thresholds. The Alertmanager component takes these alerts and routes them to various notification channels like email, Slack, or PagerDuty, ensuring timely action is taken on critical issues.
Prometheus Concept:
Data Model: Prometheus fundamentally
stores all dataas time series: streams of timestamped values belonging to thesame metricand thesame set of labeled dimensions.Besides stored time series, Prometheus may generate temporary derived time series as the result of queries.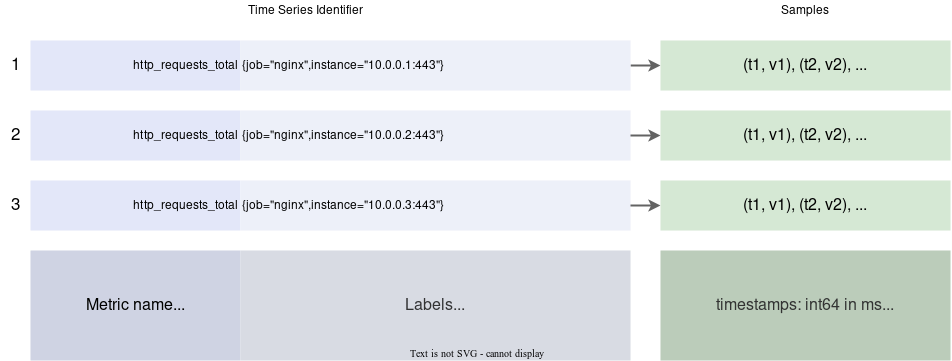
Metric Type: The Prometheus
client librariesoffer four core metric types. These are currently only differentiated in theclient libraries(to enable APIs tailored to the usage of the specific types) and in the wire protocol. The Prometheus server does not yet make use of the type information and flattens all data into untyped time series. This may change in the future.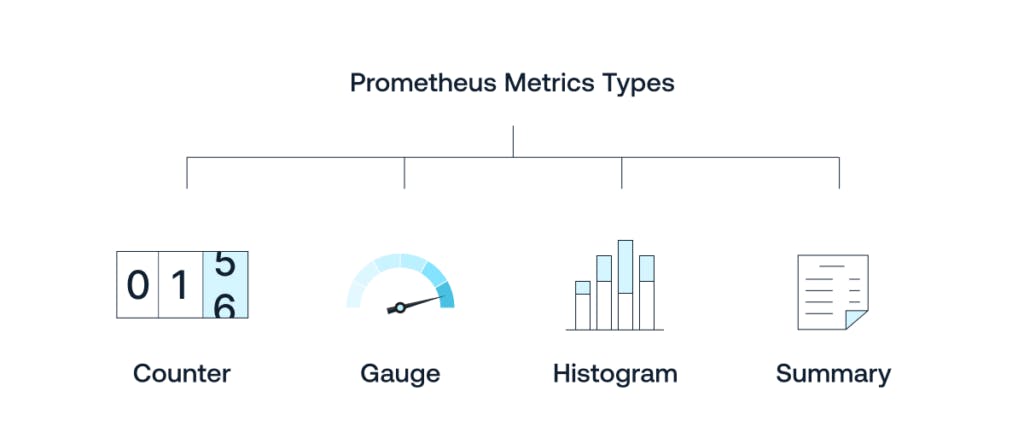
Counters: Counters are metrics that only increase over time.For example,the total number of HTTP requests served by a web server.
Gauges: Gauges represent a snapshot of a value at a specific point in time and can go up or down.For example,the current number of active connections to a database.
Histograms: Histograms provide a summary of the distribution of observed values, usually used for measuring request durations.For example,response time distribution for HTTP requests.
Summaries: Similar to histograms, summaries also provide a distribution of observed values, but with quantiles instead of buckets.For example, measuring the 95th percentile response time for a service.
- Jobs and Instances: In Prometheus terms, an endpoint you can scrape is called an
instance, usually corresponding to a single process. A collection of instances with the same purpose, a process replicated for scalability or reliability for example, is called a job.
For example, an API server job with four replicated instances:

job: api-server
instance 1: 1.2.3.4:5670
instance 2: 1.2.3.4:5671
instance 3: 5.6.7.8:5670
instance 4: 5.6.7.8:5671
Prometheus Remote-Write Specification: The remote write specification is intended to document the standard for how Prometheus and Prometheus remote-write-compatible agents send data to a Prometheus or Prometheus remote-write compatible receiver.

What are the Default Retention Period of Prometheus ?
By default, Prometheus retains metrics data for 15 days. This retention period is controlled by the
--storage.tsdb.retention.timeconfiguration option. After this period, data older than the specified retention time is automatically deleted to manage storage space. Keep in mind that administrators can customize this retention period based on their specific requirements by adjusting the configuration accordingly.