

In the Last Blog Day 78 we have seen the basic introduction of Prometheus,its features,components and Architecture.
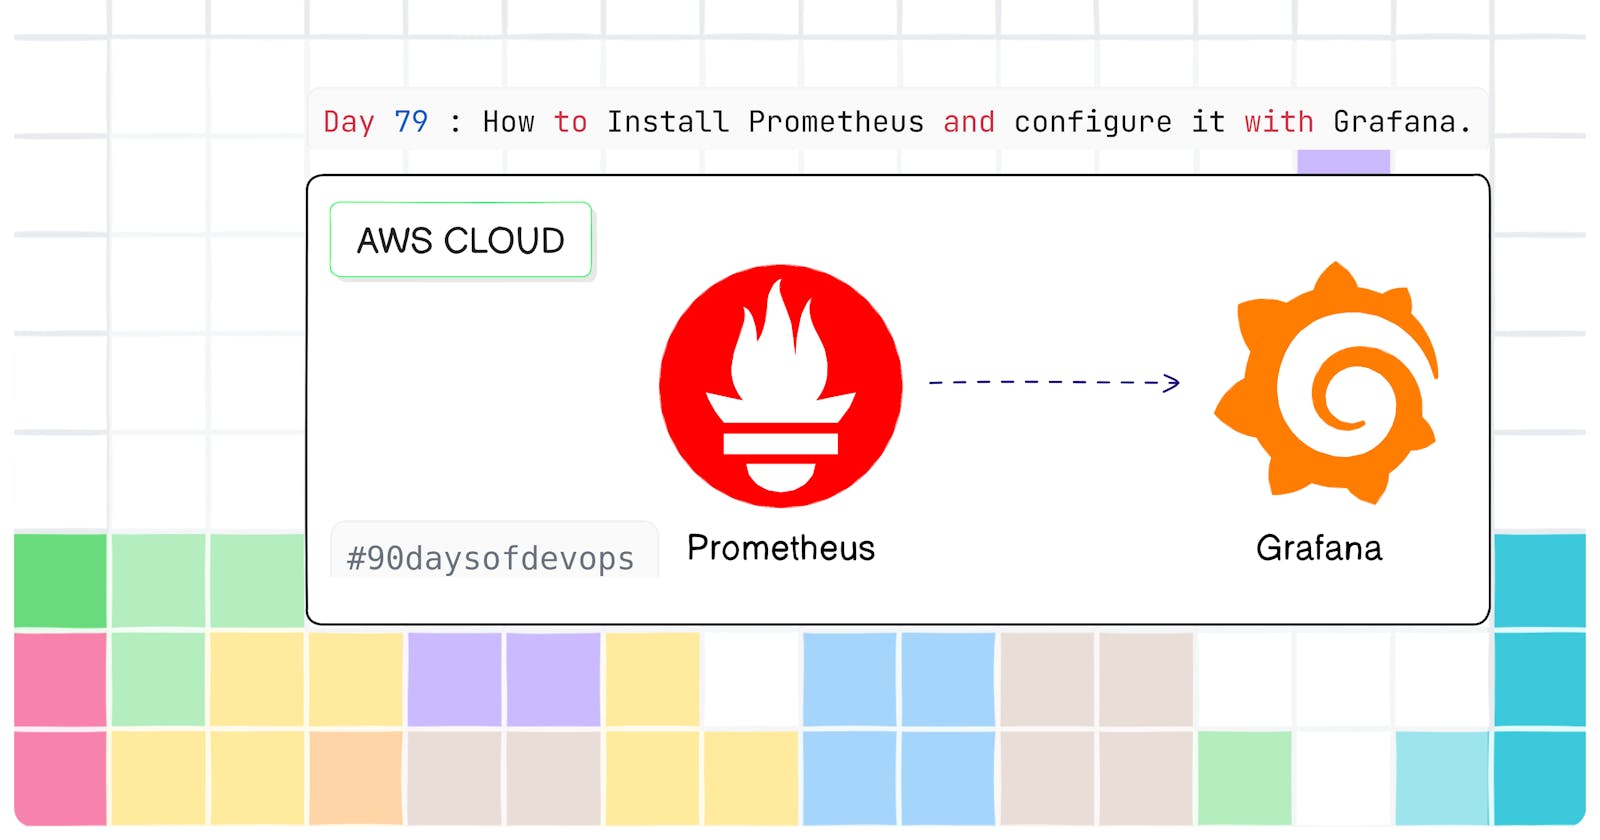
In this Blog we will see How to Install Prometheus and configure it with Grafana.
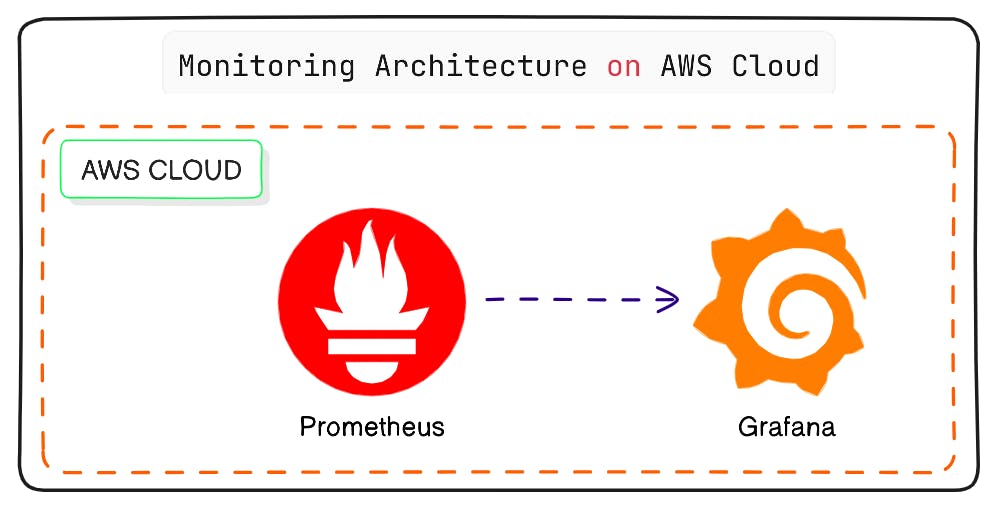
What does Prometheus do and why do we integrate it with Grafana?
Prometheus is a monitoring tool that is used to collect metrics from our services and infrastructure. It is a time series database that stores metrics in the form of key-value pairs. Prometheus has a built-in query language called PromQL that allows us to query the metrics that it collects. Prometheus also has a built-in alerting system that allows us to create alerts based on the metrics that it collects. Prometheus is open-source and free to use.
Grafana is a data visualization tool that allows us to create dashboards and visualize the data that we send to it. Grafana is open-source and free to use.
Prometheus and Grafana are often used together. Prometheus is used to collect metrics and Grafana is used to visualize the metrics that Prometheus collects. Grafana can also be used to create alerts based on the metrics that Prometheus collects.
Prometheus Installation :
You can obtain Prometheus as a precompiled binary directly from the GitHub repository. The Prometheus Downloads repository provides information on the latest released version of Prometheus.
Download the latest version of Prometheus : Prometheus Downloads
Use
wgetto download the latest version of Prometheus:
# wget https://github.com/prometheus/prometheus/releases/download/v[release]/prometheus-[release].linux-amd64.tar.gz

wget https://github.com/prometheus/prometheus/releases/download/v2.49.1/prometheus-2.49.1.linux-amd64.tar.gz
- Extract the downloaded archive:
# tar -xvf prometheus-[release].linux-amd64.tar.gz

tar -xvf prometheus-2.49.1.linux-amd64.tar.gz
- (Optional) Delete the downloaded archive:
# rm prometheus-[release].linux-amd64.tar.gz

rm prometheus-2.49.1.linux-amd64.tar.gz
- Establish
two fresh directoriesto be utilized by Prometheus. The configuration files for Prometheus will be stored in the/etc/prometheusdirectory, while the application data will be housed in the/var/lib/prometheusdirectory.
sudo mkdir /etc/prometheus /var/lib/prometheus
- Now change directory into the directory prometheus-2.49.1.linux-amd64.
cd prometheus-2.49.1.linux-amd64
- Now move the
prometheusandpromtoolbinaries to the/usr/local/bindirectory.
sudo mv prometheus promtool /usr/local/bin
- Now move the
consolesandconsole_librariesdirectories to/etc/prometheus.
sudo mv consoles/ console_libraries/ /etc/prometheus
- Thus we have successfully installed Prometheus.
# verify the installation

prometheus --version
Setup Grafana on AWS EC2.
Step-01: Launch an EC2 instance with
Ubuntu 22.04AMI ,t2.microinstance type and8GBstorage.
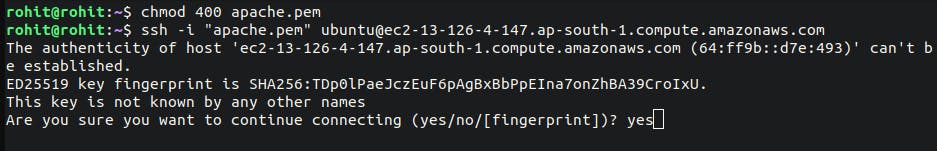
- Step-02: Now connect to the instance using SSH.
- Step-03: Now update the instance.
sudo apt update
- Step-04: Install the Pre-requisites Packages of Grafana.
sudo apt-get install -y apt-transport-https software-properties-common wget

- Step-05: Add the GPG key for the official Grafana repository to your system.
sudo mkdir -p /etc/apt/keyrings/
wget -q -O - https://apt.grafana.com/gpg.key | gpg --dearmor | sudo tee /etc/apt/keyrings/grafana.gpg > /dev/null

- Step-06: Add the Grafana repository to the sources list for stable releases.
echo "deb [signed-by=/etc/apt/keyrings/grafana.gpg] https://apt.grafana.com stable main" | sudo tee -a /etc/apt/sources.list.d/grafana.list

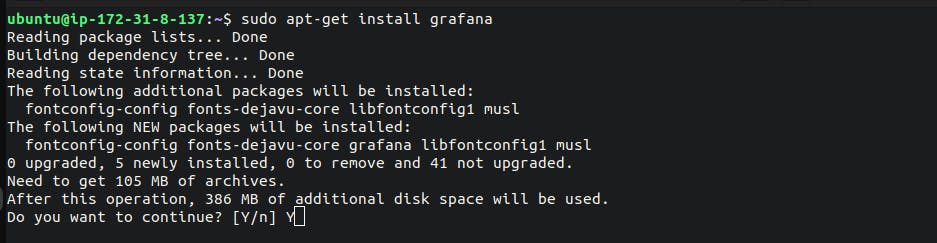
- Step-07: Update the apt package list and install the latest version of Grafana.
sudo apt-get update
sudo apt-get install grafana
- Step-08: Start the Grafana service and enable it to start at boot time.
sudo systemctl start grafana-server
sudo systemctl status grafana-server

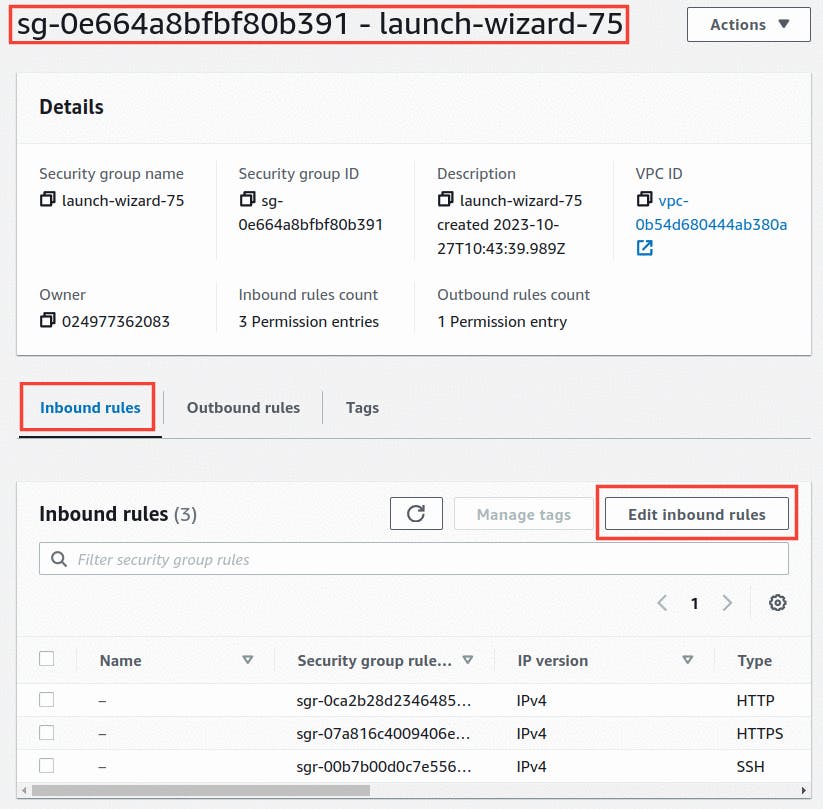
- Step-09: Now let's configure the port
3000in the security group of the instance first select the instance and then click on the security group.

- Step-10: Now click on the inbound rules and then click on the edit inbound rules.
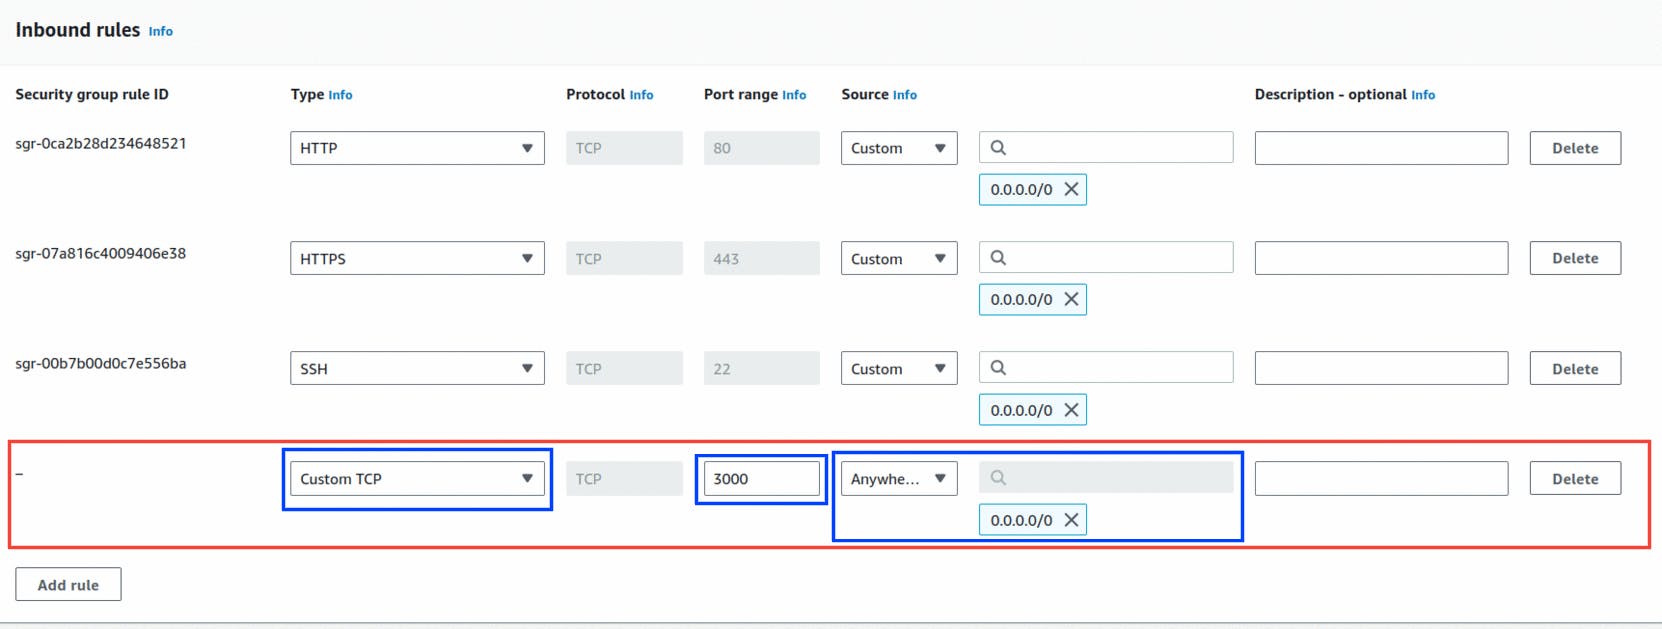
- Step-11: Now click on the add rule and then select the custom TCP and then enter the port number
3000and then click on the save rules.
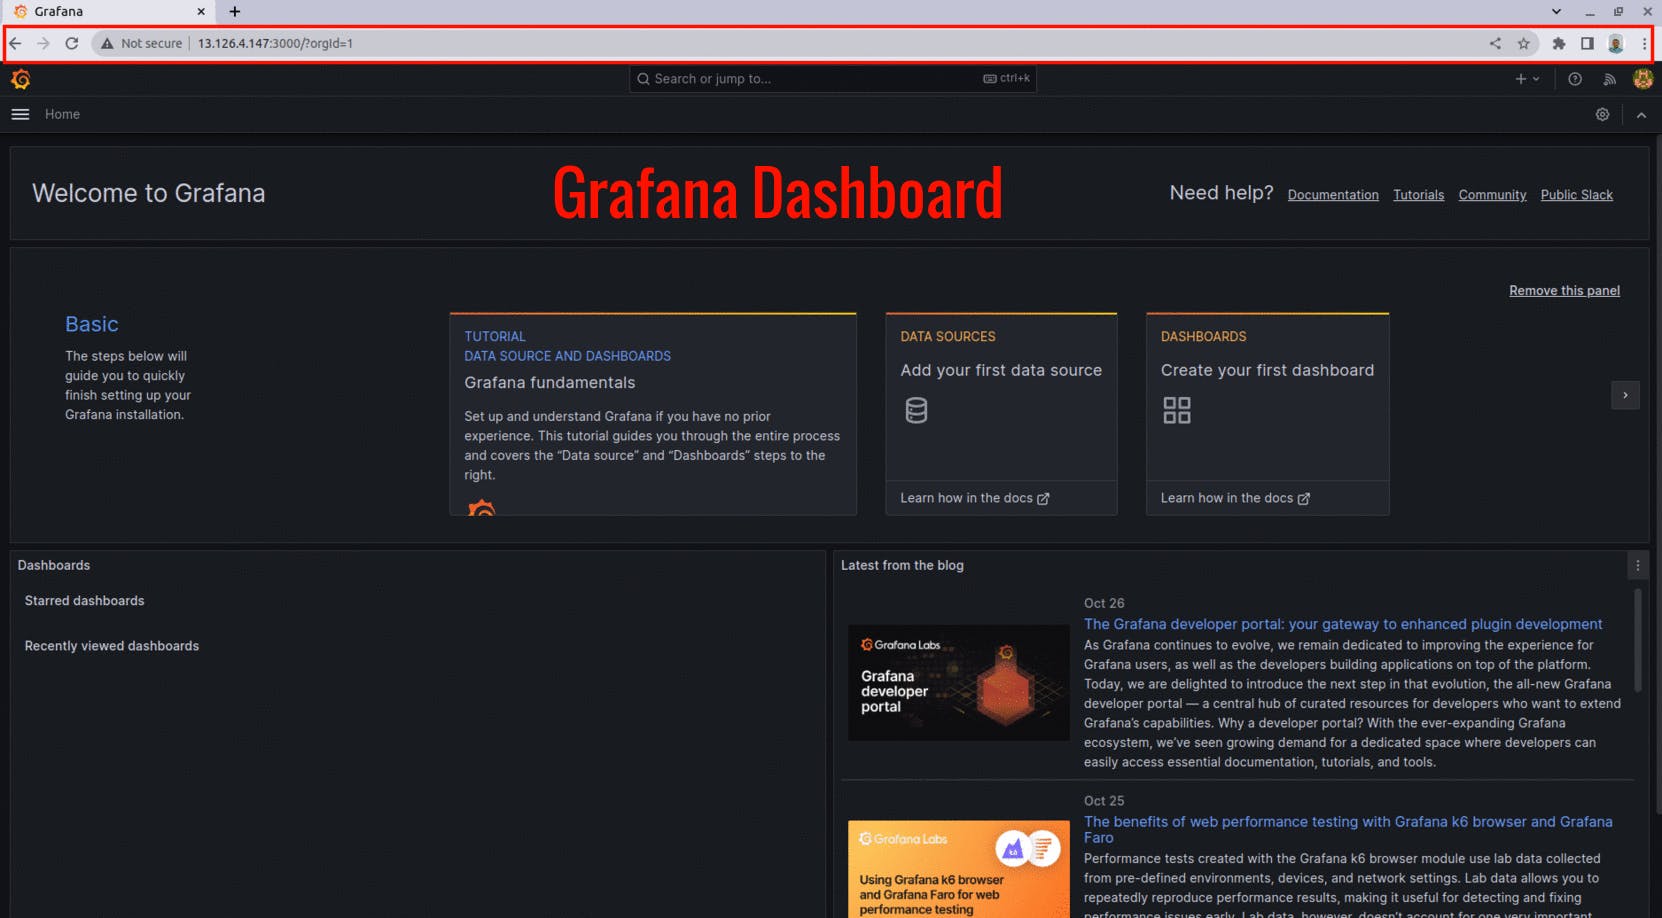
- Step-12: Now open the browser and then enter the public IP of the instance with the port number
3000and then click on the enter.

- Step-13: Now you see the Grafana Dashboard.
Configure Prometheus with Grafana :
Step-01: Now on the left side we see the
Settings iconoption which is Configuration click on it and then click on the Data Sources.
Step-02: Now click on the Add data source and search for the Prometheus and then click on the select.

- Step-03: Click on the Prometheus to add the data source.

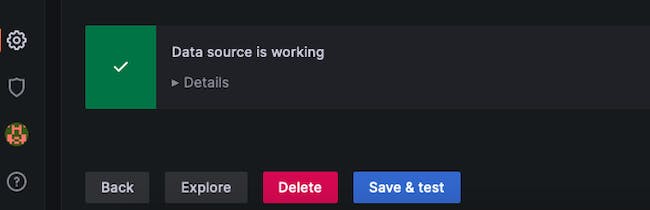
- Step-04: Now enter the name of the data source and then enter the URL of the Prometheus and then click on the save and test.
Name : Prometheus
URL : http://localhost:9090
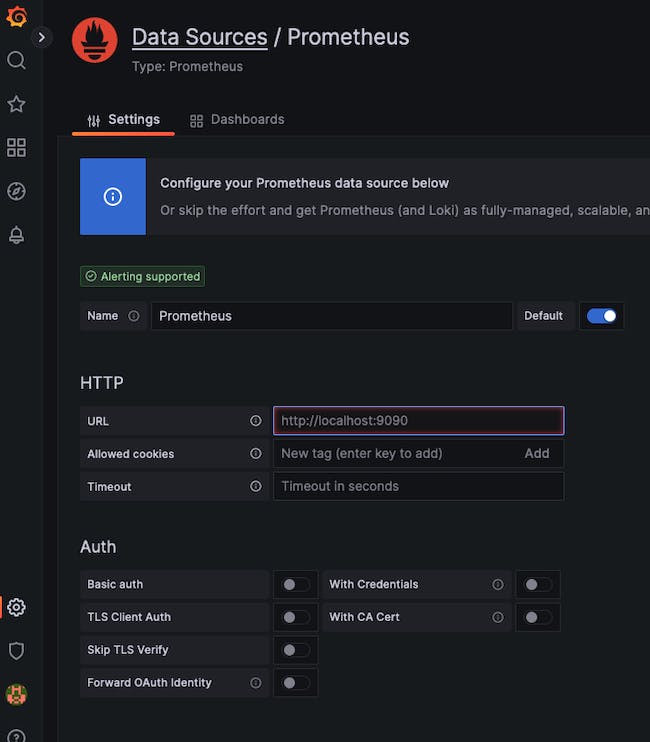
- Step-05: Check the Alerting and then click on the save and test.

Thus we have successfully configured Prometheus with Grafana.